Executive Summary
Key findings from TXOne Threat Intelligence System honeypot telemetry across January–June 2026:
- March 2026 was the most significant month by attacker diversity and breadth, with CVE-tagged IPS hits, attack-payload diversity, and ICS/OT protocol scanning activity all spiking simultaneously, though raw session volume peaked two months later, in May.
- Over 91% of malware downloads were delivered over SMB (445/TCP), making legacy SMB exposure the single largest malware delivery vector observed.
- 97% of sessions from the 99 highest-volume attacker IPs were traced back to cloud and VPS hosting providers rather than residential or business networks.
- MS17-010-era SMB exploitation (CVE-2017-0147, patched by Microsoft in the same March 2017 MS17-010 bulletin that addressed EternalBlue's CVE-2017-0144) remains one of the most persistent patterns across both malware and IPS telemetry, alongside decades-older defaults like CVE-1999-0517.
- A cluster of credential attempts targeting Solana blockchain infrastructure appeared alongside the usual IoT credential-stuffing activity, consistent with application-aware attacker tooling.
Background
Three independent telemetry streams — CVE-tagged IPS exploitation attempts, unique attack payload diversity, and ICS/OT protocol scanning — all converged on the same signal: a broad scanning surge in March 2026, visible across every one of TXOne's telemetry sources. Attack-session volume itself ultimately peaked two months later, in May, but by the more telling measure of attacker diversity and experimentation, March was the period that stood out most. Attackers also showed a second shift: alongside the usual IoT credential stuffing, a cluster of credential attempts tailored to Solana blockchain infrastructure has appeared for the first time.
Across the first half of 2026, TXOne Threat Intelligence System recorded continuous port-scanning activity against the ICS/OT protocols it emulates and close to 905,000 CVE-tagged exploitation attempts on IPS sensors, on top of a wide range of malware activity detailed below. These aren't disconnected statistics. Read together, they tell one continuous story: what malware actually got through, where the traffic that delivered it came from, what infrastructure and behavior sit behind that traffic, and which specific doors (credentials, known exploits, and industrial protocols) attackers tested most.
The overall pattern is consistent with what we've reported in prior periods: opportunistic, largely automated attacks that exploit long-known vulnerabilities at scale, punctuated by sharp, short-lived spikes rather than a steady climb.
Attack Trend
The story starts with how much attack traffic actually hit the honeypots, and how that volume changed from month to month.
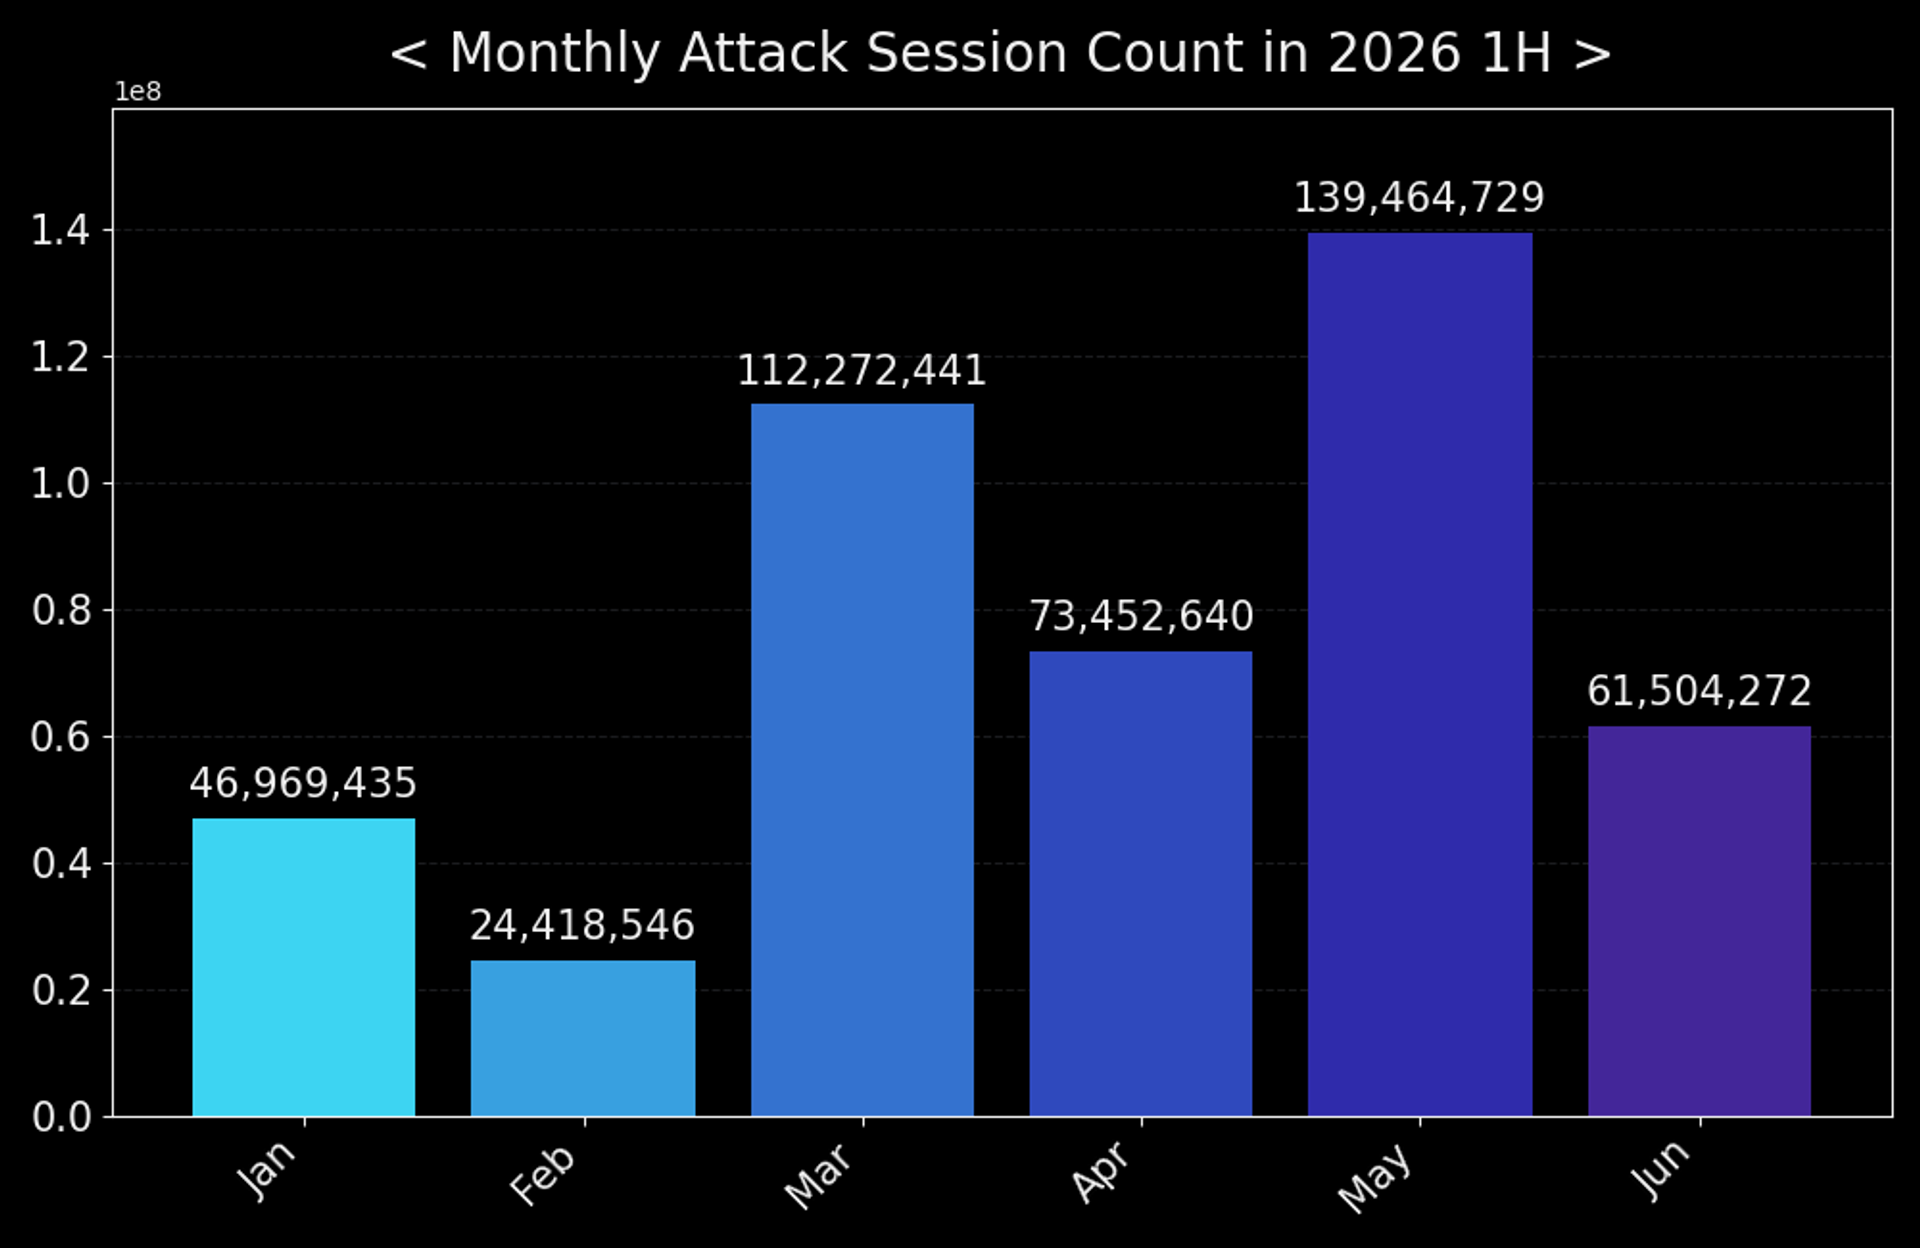
Session volume was lowest in February (24.42M) and climbed unevenly from there: a sharp jump to 112.27M in March, a pullback to 73.45M in April, then the highest month by a clear margin — 139.46M in May — before dropping to 61.50M in June. In other words, raw connection volume peaked in May, not March.
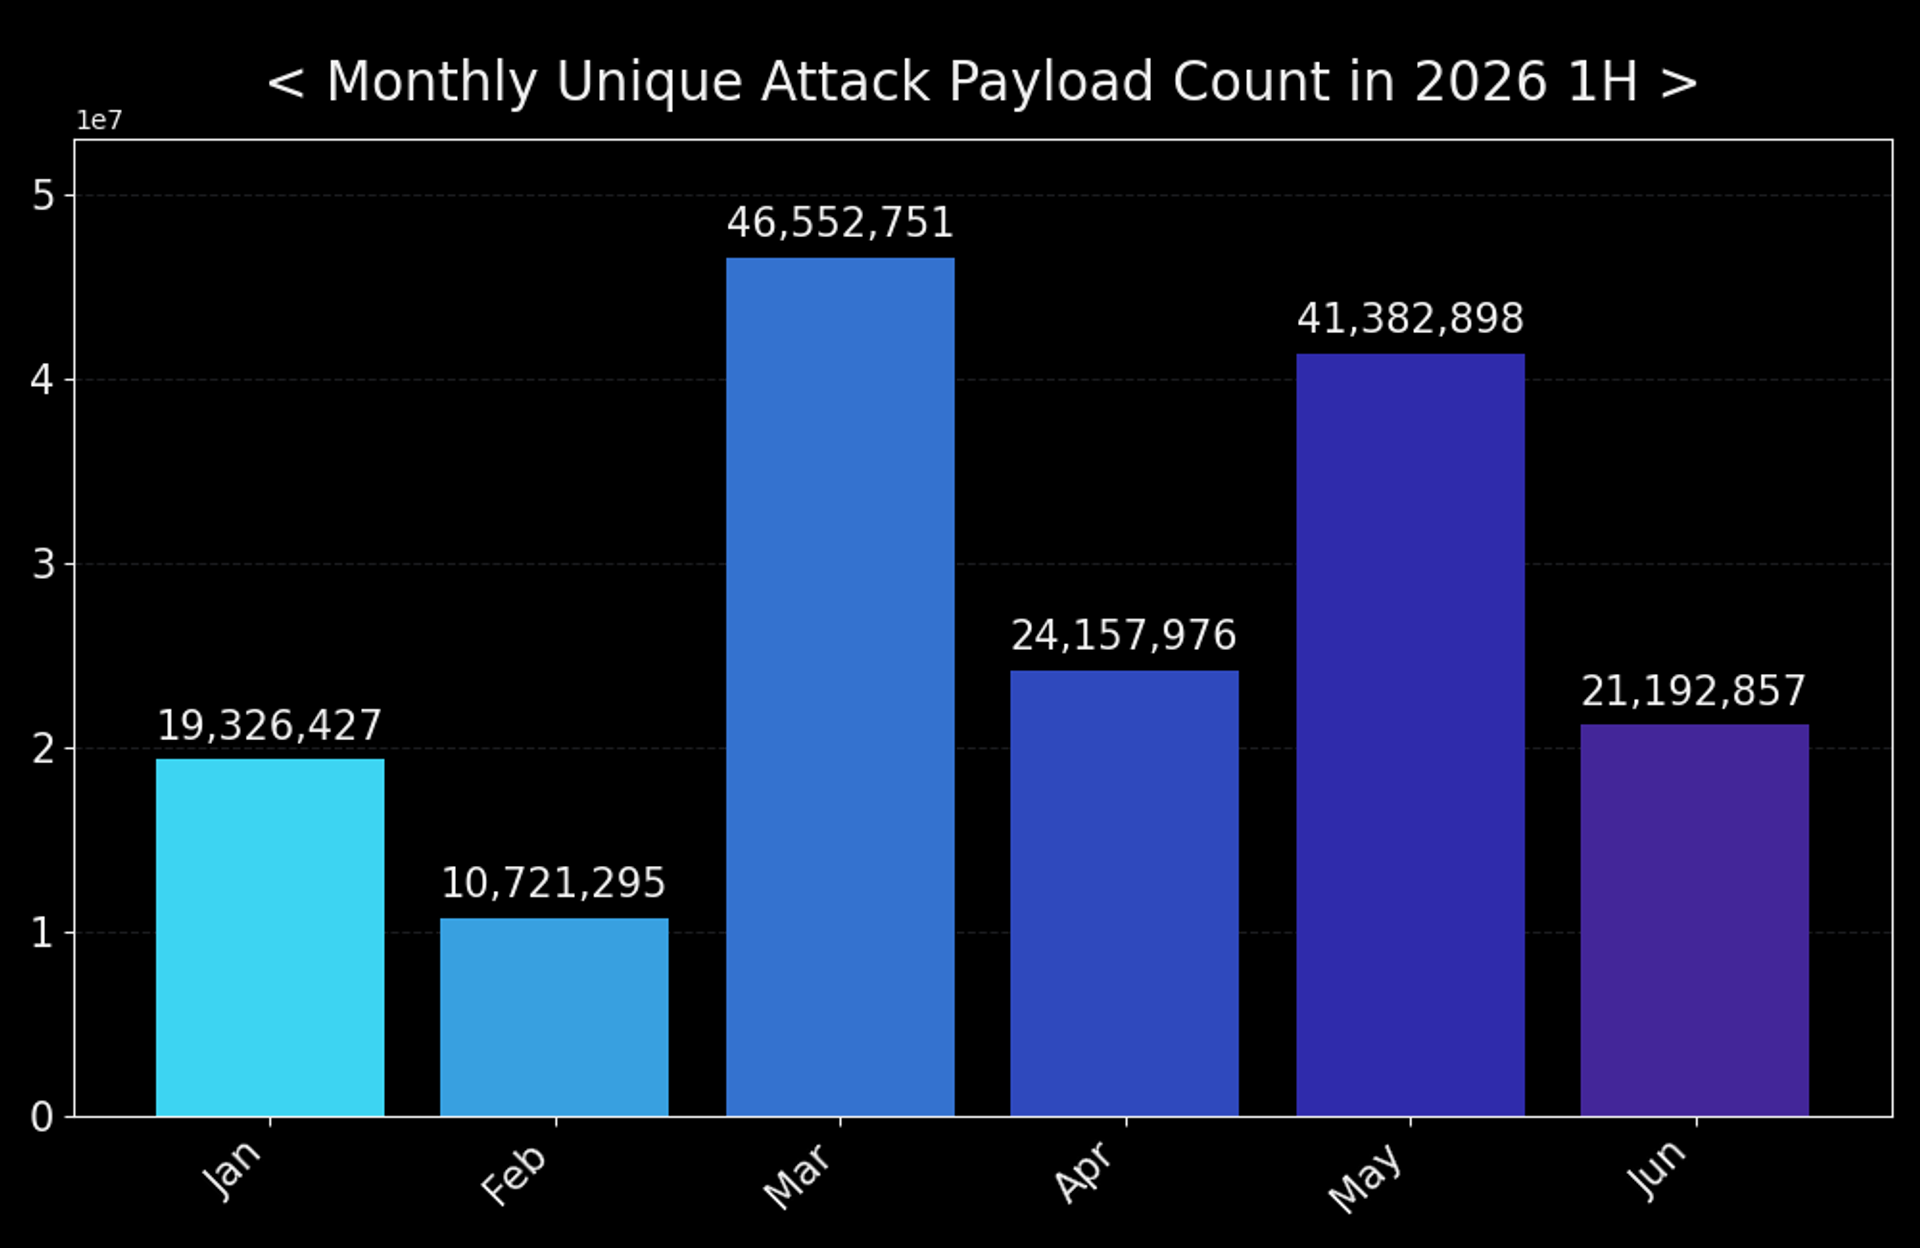
Payload diversity tells a related but different story. Unique payloads were also lowest in February (10.72M), but here March is the standout at 46.55M — the most of any month in the half-year — before dropping to 24.16M in April and climbing back up to 41.38M in May. March didn't produce the most attack sessions, but it did produce the widest variety of distinct payloads, a pattern that lines up with the same month's CVE-hit and ICS/OT scanning spikes covered later in this report.
High session volume often signals scale, with more scanners and more automated repeat attempts, while high payload diversity is a stronger signal of exploratory activity: new tooling, new targets, and new techniques being tried out. By that measure, March, not May, was the most significant month of the reporting period.
Zooming in from overall attack volume to what actually got delivered, three malware families stood out, two by sheer volume, one by how fragmented it was:
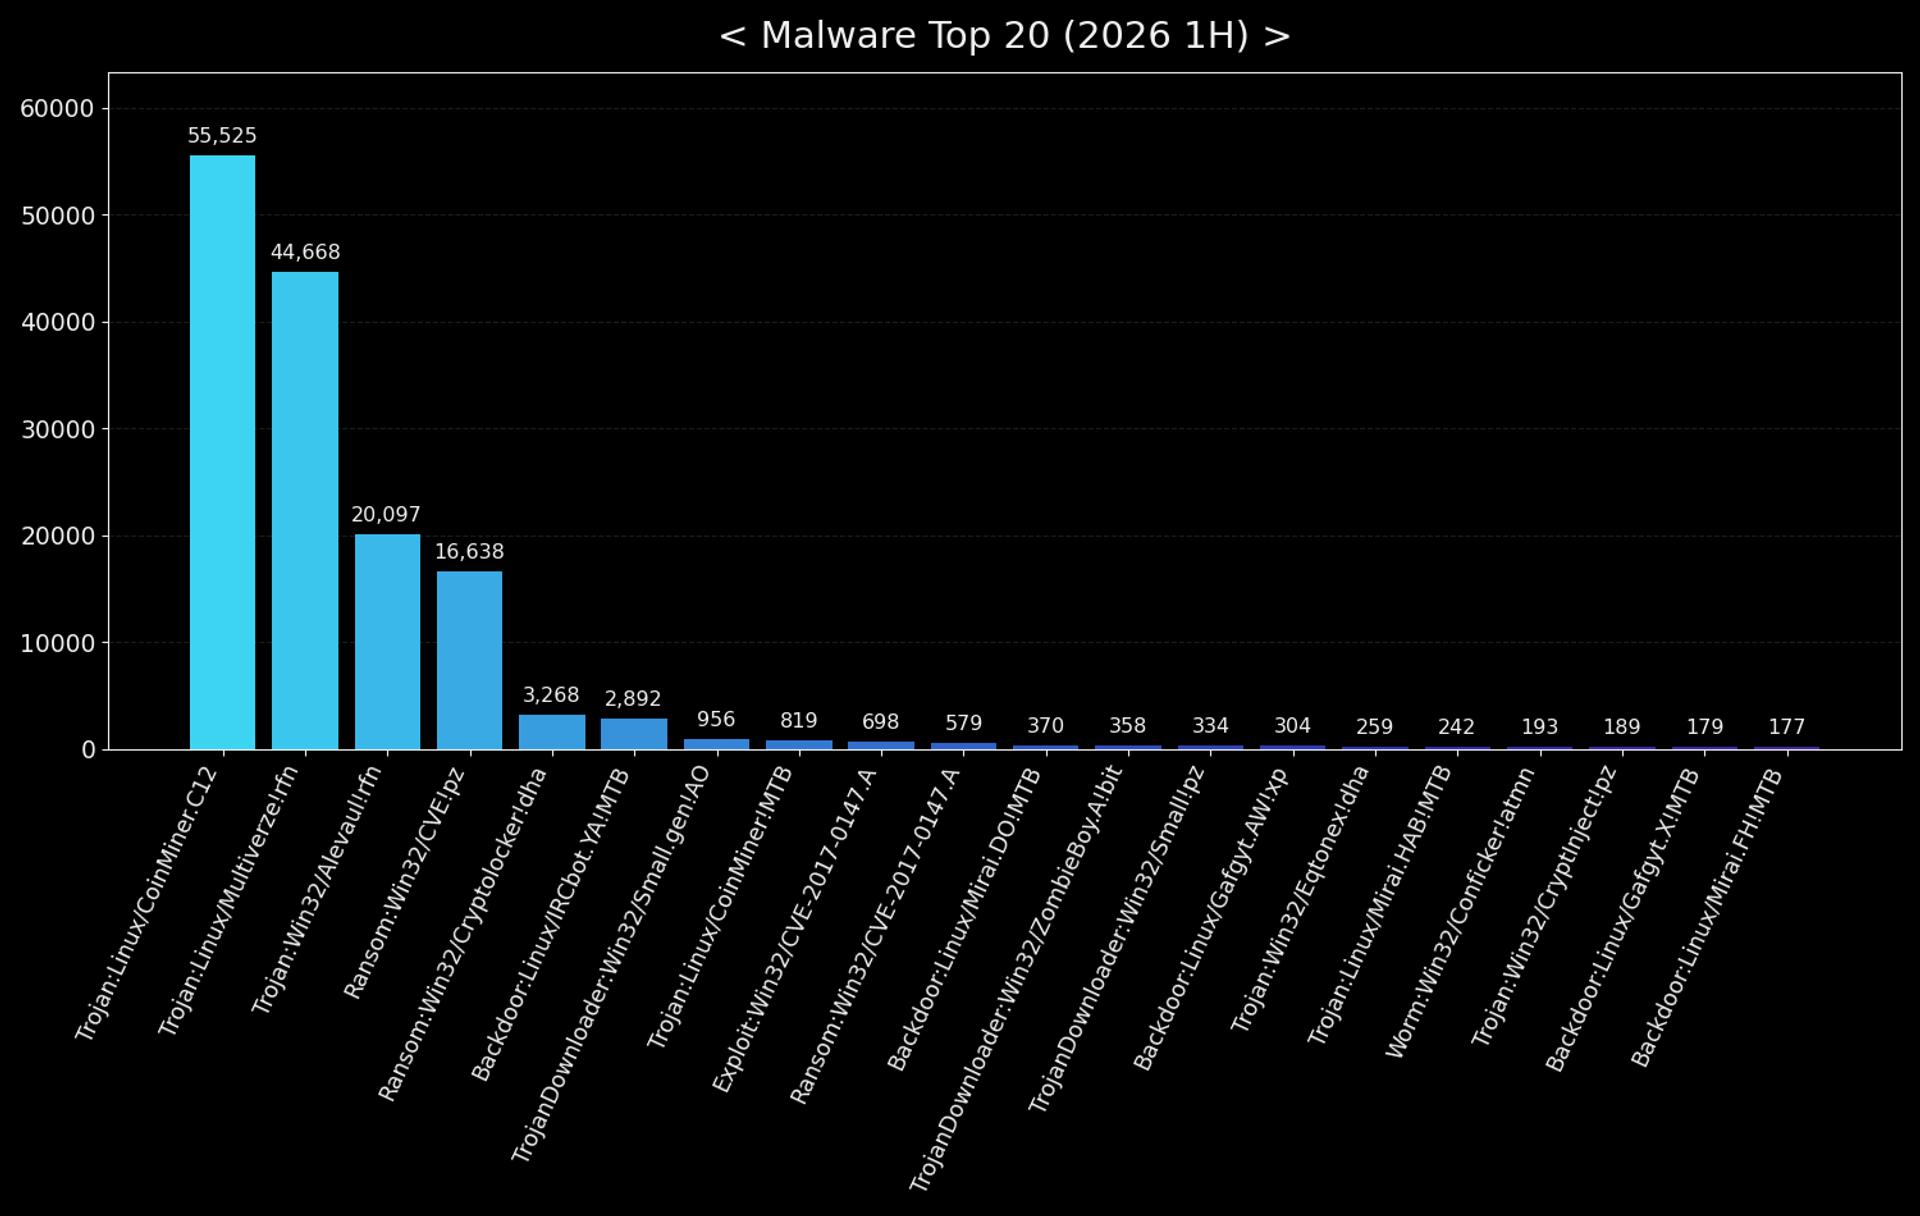
- Trojan:Linux/CoinMiner.C12 — 55,525 detections across just 7 unique variants. A high-volume, low-variation cryptomining payload, consistent with a single automated campaign reusing the same binary.
- Trojan:Linux/Multiverze!rfn — 44,668 detections across 263 variants. Far more polymorphic, suggesting either a builder-based toolkit or a packer producing fresh hashes per drop.
- Ransom:Win32/CVE!pz — 16,638 detections but 2,539 unique variants, the most fragmented family observed. This generic detection name covers exploit-delivered ransomware droppers, and its variant count implies heavy use of crypters/packers to evade signature detection.
(Trojan:Win32/Alevaul!rfn — a Windows-targeting trojan downloader that retrieves and executes additional malware from remote servers — actually ranks third by volume, with 20,097 detections, but isn't examined in the same depth here.)
Together, these three families point to a mix of monetization strategies rather than a single campaign: high-volume, low-effort cryptomining for steady automated returns; a polymorphic, actively repacked trojan family built for evasion at scale; and a fragmented ransomware family that appears aimed at a smaller subset of compromised systems presumed to offer a higher payout.
Notably, detections tied to CVE-2017-0147 — an SMBv1 information-disclosure flaw patched under the same MS17-010 bulletin as EternalBlue (CVE-2017-0144) — still appear, by name, in both exploit and ransomware form nearly a decade after disclosure. This serves as a reminder of how long unpatched SMB exposure keeps paying off for attackers, a theme that resurfaces later in the IPS data as well.
That SMB connection shows up directly in how this malware actually got delivered:
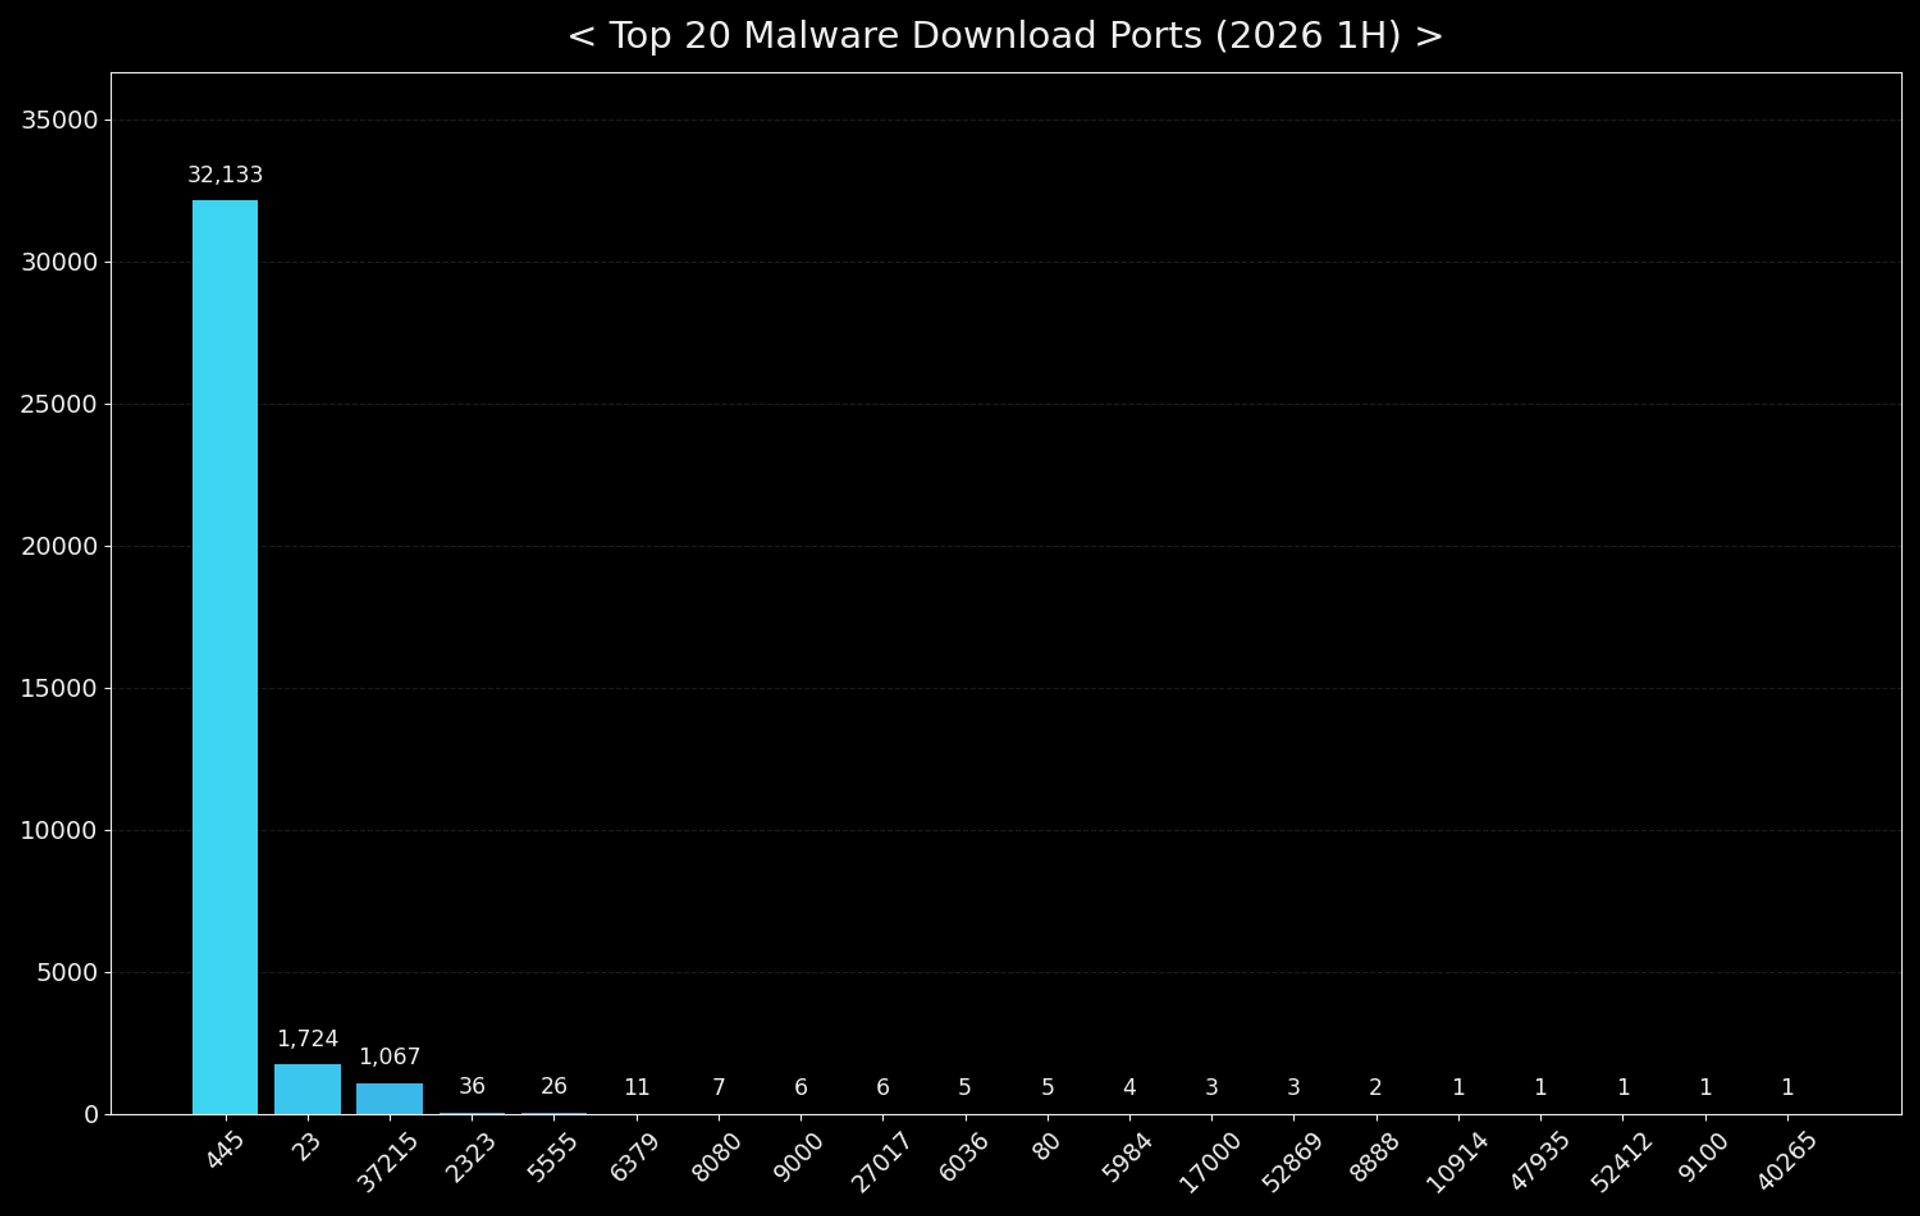
445/TCP accounted for 32,133 of 35,043 total download events, over 91%. Telnet (23/TCP, 1,724 events) was a distant second, largely tied to IoT botnet families like Mirai and Gafgyt that also appear in the top-20 malware list. Every other port combined made up roughly 3% of observed downloads (1,186 events across 18 ports), a striking concentration of activity on one legacy protocol. The next question is where that concentrated traffic was actually coming from.
Attack Origins
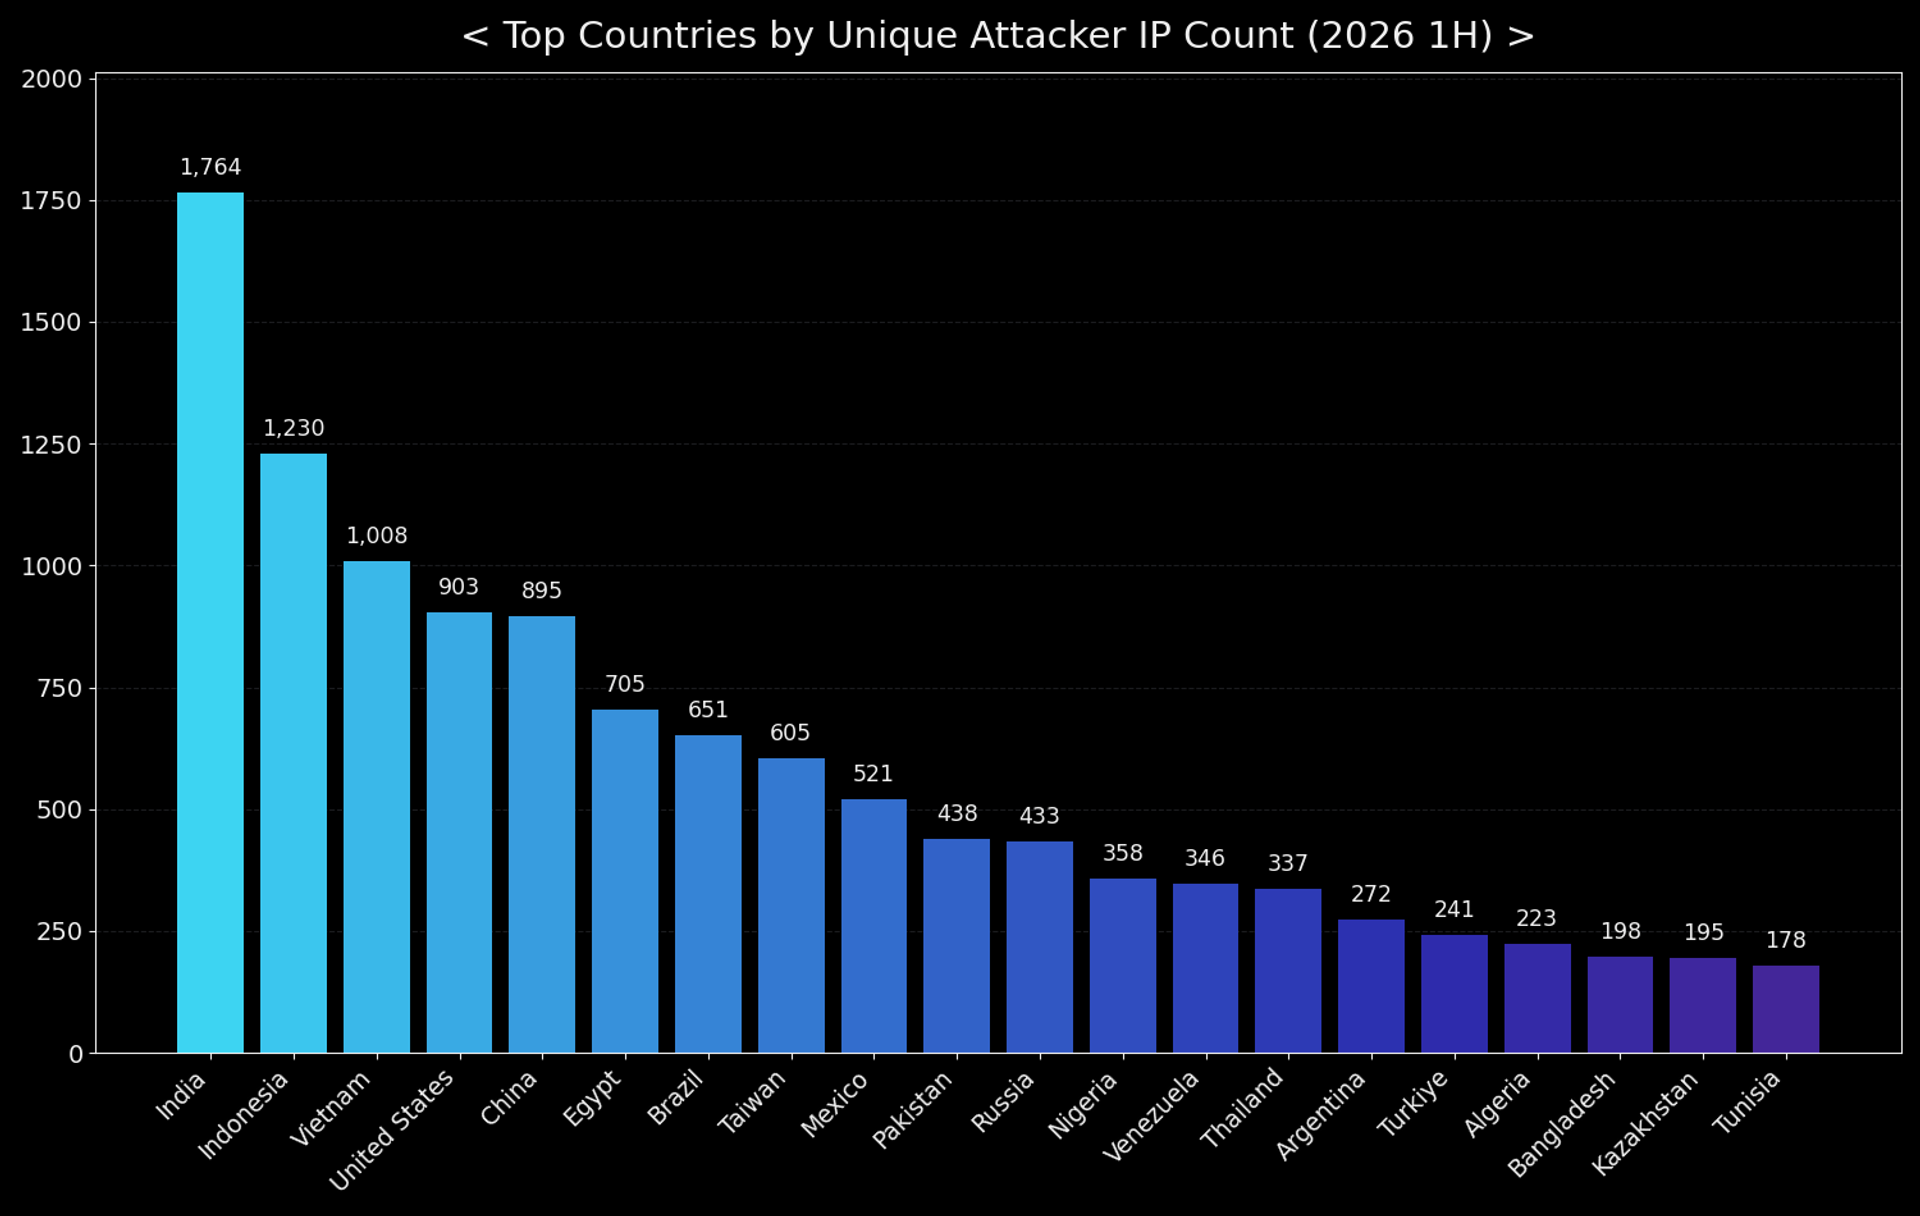
India led with 1,764 unique attacking IPs, followed by Indonesia (1,230), Vietnam (1,008), the United States (903), and China (895). South and Southeast Asia dominate the top of the list in a pattern that more likely reflects where compromised, internet-facing devices are concentrated (residential routers, IoT, poorly secured cloud instances) than the physical location of the operators behind these campaigns. Country attribution alone has limited intelligence value: it says only where an IP happens to sit, not what infrastructure it's actually running on or who's behind it. That distinction turns out to matter a great deal once you look closer, as the ASN enrichment below shows.
Attacker Infrastructure: Cloud and VPS, Not Home Routers
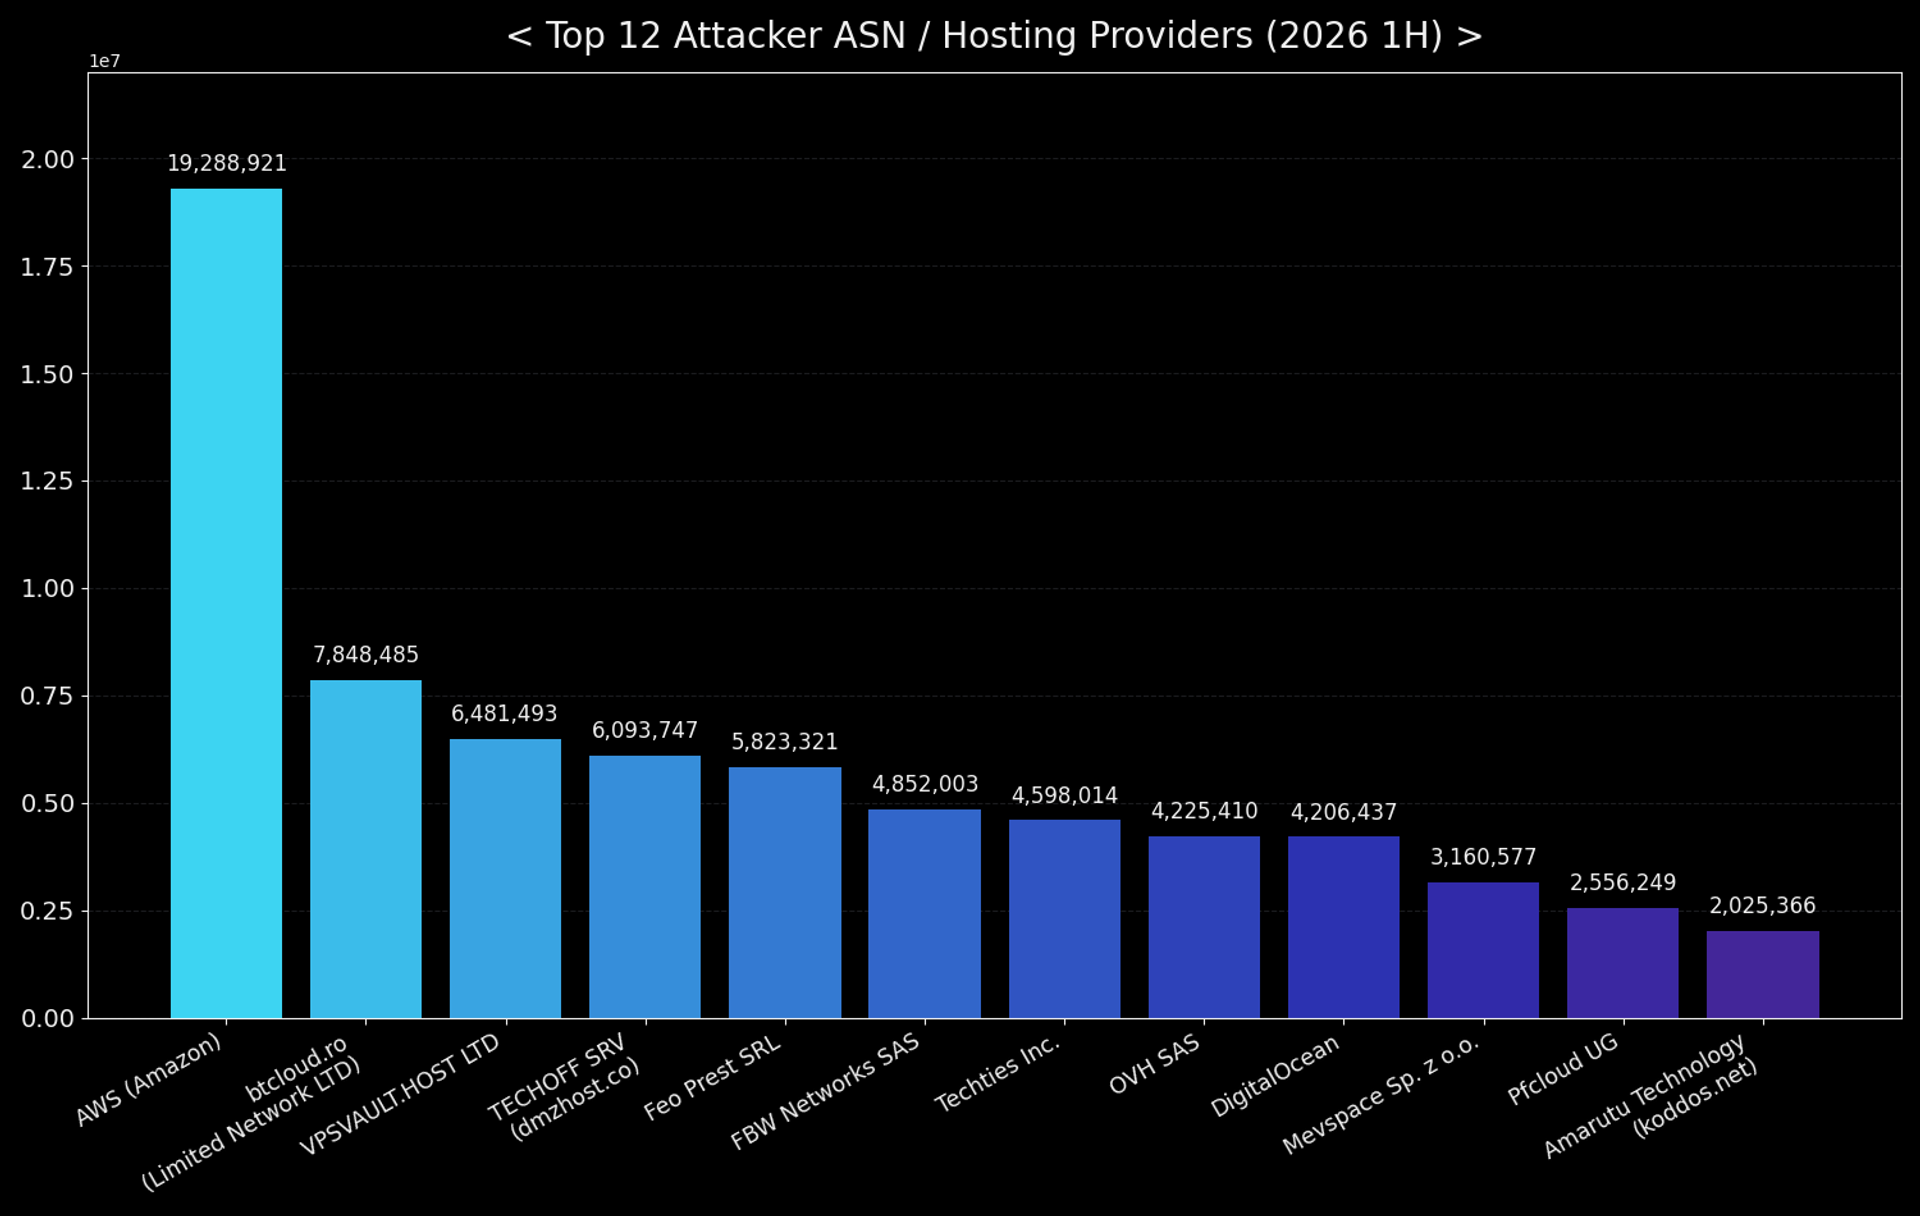
The country breakdown above shows where traffic entered from, but ASN enrichment of the 99 highest-volume attacker IPs (94.4 million honeypot sessions between them) shows what that traffic is actually running on. The answer is overwhelmingly cloud and VPS infrastructure: 97.2% of sessions from this set trace back to hosting providers, versus 2.1% to business networks and well under 1% to residential ISPs.
AWS alone accounts for 20.4% of the total, spread across 17 rotating IPs, consistent with short-lived EC2 instances spun up for scanning and automatically torn down. Right behind it is a single IP, 45.142.193.xxx, sitting on a small Romanian VPS provider (btcloud.ro). It's responsible for 7.8 million sessions on its own — more traffic than every other individual provider in the top 12 except AWS. The rest of the list is standard bulletproof/budget-VPS territory: OVH, DigitalOcean, and several lesser-known European hosts (VPSVAULT.HOST, TECHOFF SRV/dmzhost.co, Feo Prest SRL, FBW Networks) built for cheap, disposable compute.
Infrastructure explains how attackers reach a target in the first place: the scanning and port-probing traffic that drives most of this session volume runs on rented cloud compute. That makes reputation/ASN-based blocking of bulk-hosting ranges a realistic control here, in a way it wouldn't be against a genuinely distributed botnet. But infrastructure doesn't reveal what attackers actually try once a connection is open. That's where credentials come in.
Credential Attack Patterns
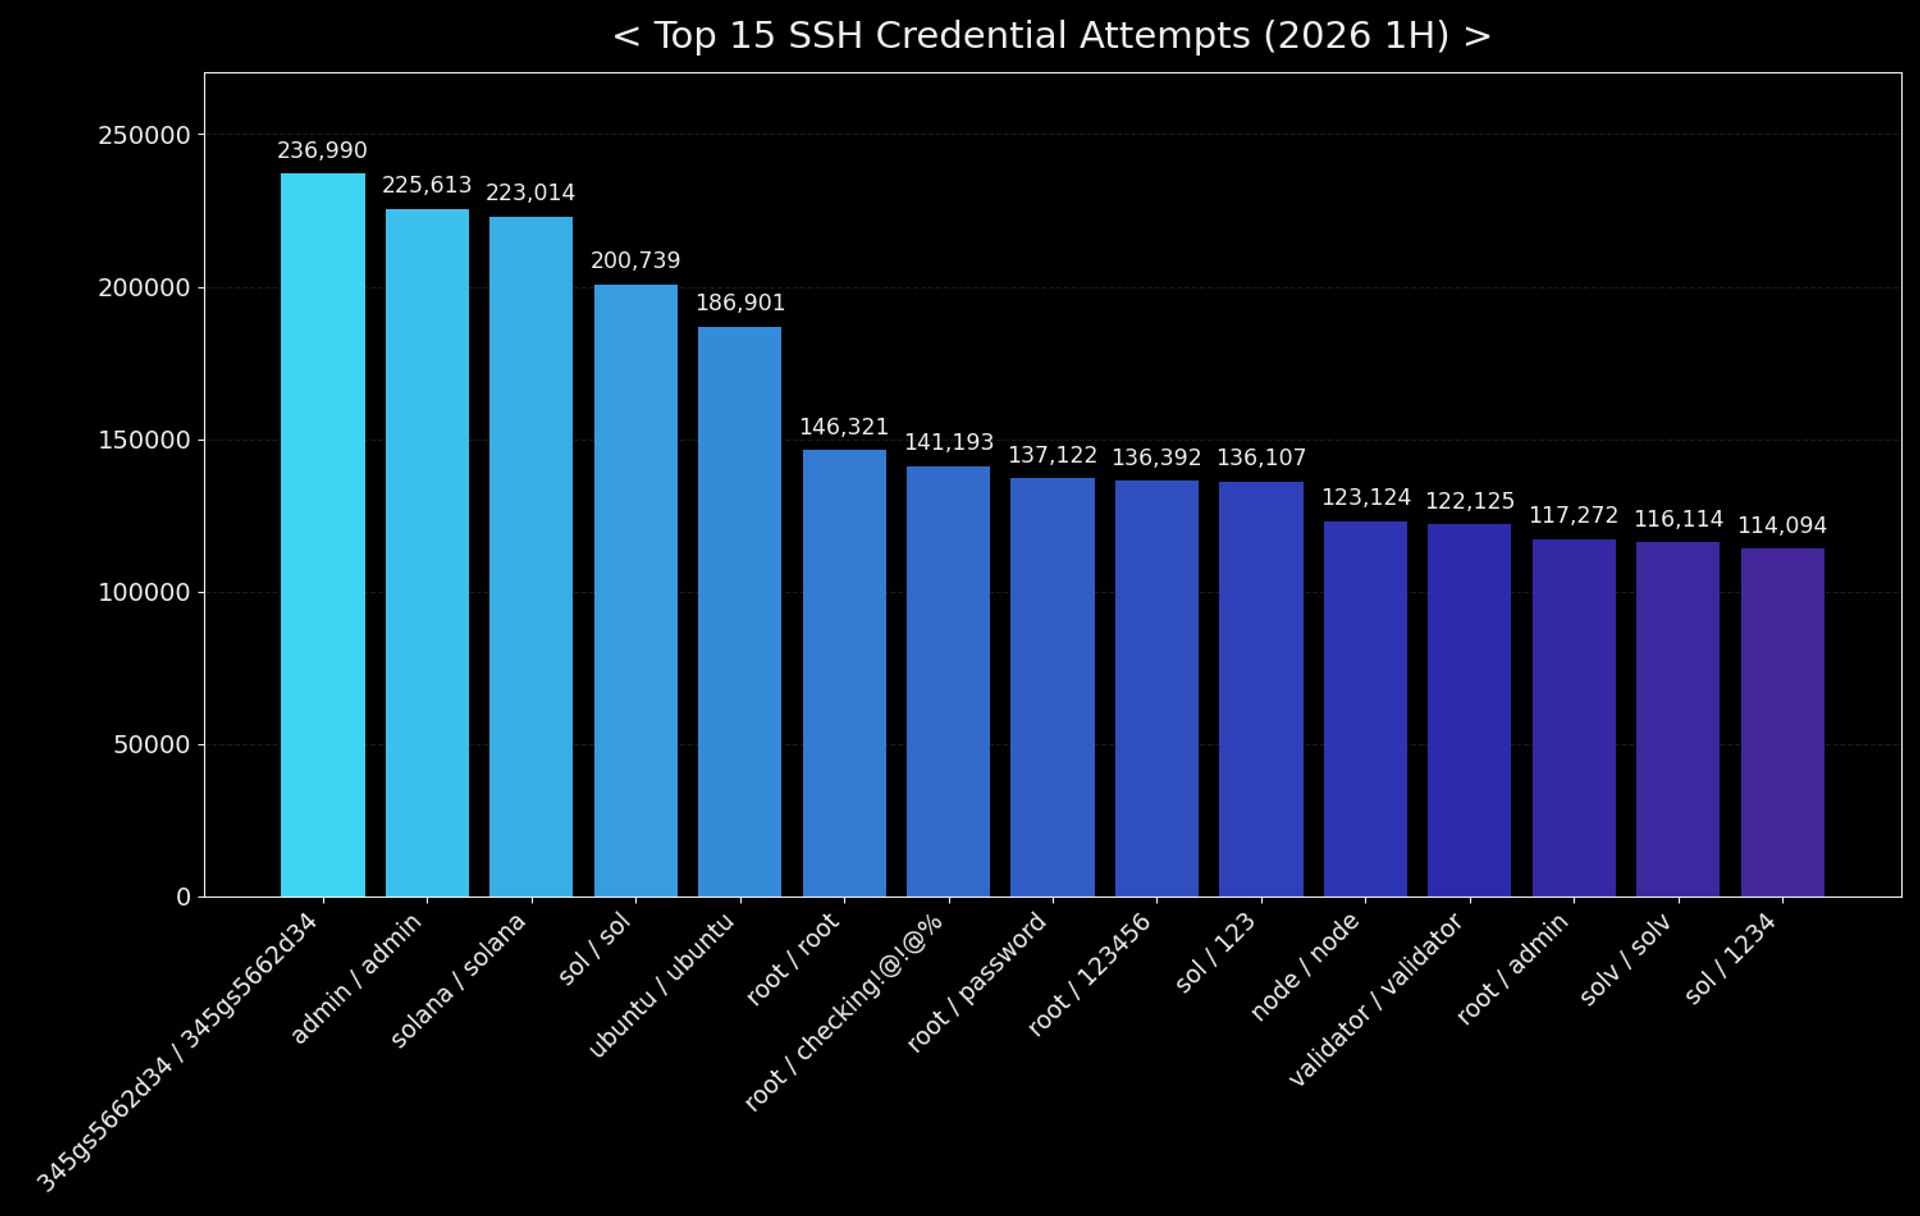
Looking at the credentials attackers actually tried against the SSH honeypots adds a behavioral layer on top of the infrastructure view above. Notably, this traffic carries a different signature than the cloud/VPS-heavy scanning just described, with clearer IoT-botnet fingerprints. Of the roughly 3.9 million blank or incomplete login attempts and 1.5 million literal "0/0" attempts (both typical of mass port-scanners that never intend to complete authentication), the remaining traffic splits into two distinct clusters.
The first is a generic credential-stuffing list straight out of the Mirai/Gafgyt playbook: admin/admin (225,613), ubuntu/ubuntu (186,901), root/root (146,321), root/password, root/123456, and root/admin — the same handful of IoT and cloud-image default logins that show up in every honeypot report.
The second is more specific and more interesting: a cluster of attempts built around solana/solana (223,014), sol/sol (200,739), sol/123, sol/1234, node/node (123,124), validator/validator (122,125), and solv/solv (116,114) — a credential list tailored to Solana blockchain validator and RPC node deployments rather than generic servers. Unlike the generic default-credential stuffing typical of IoT botnets, this Solana-focused cluster is consistent with application-aware targeting — credential attempts tailored to a specific technology ecosystem rather than a single generic wordlist reused against everything scanners find.
The single largest non-blank entry, 345gs5662d34 (236,990 attempts, used as both username and password, and again as a password paired with root), is not part of this crypto-targeting cluster despite the coincidental overlap. Per SANS Internet Storm Center's research (isc.sans.edu/diary/31360), this string is a known default password for Polycom CX600 IP phones. It commonly shows up in the username field too, because sloppy scanning bots reuse it across both fields indiscriminately. Its position at the top of our list reflects the same generic IoT credential-stuffing activity as the Mirai/Gafgyt defaults above, not a dedicated Solana-focused tool. A likely fingerprinting probe, root/checking!@!@% (141,193 attempts), rounds out the non-blank traffic. Some scanners use it to test how a target responds before proceeding with further attempts.
Guessing credentials is one way in. As the IPS telemetry from this half-year shows, exploiting a known software flaw is the other.
Exploited Vulnerabilities: What the IPS Sensors Detected
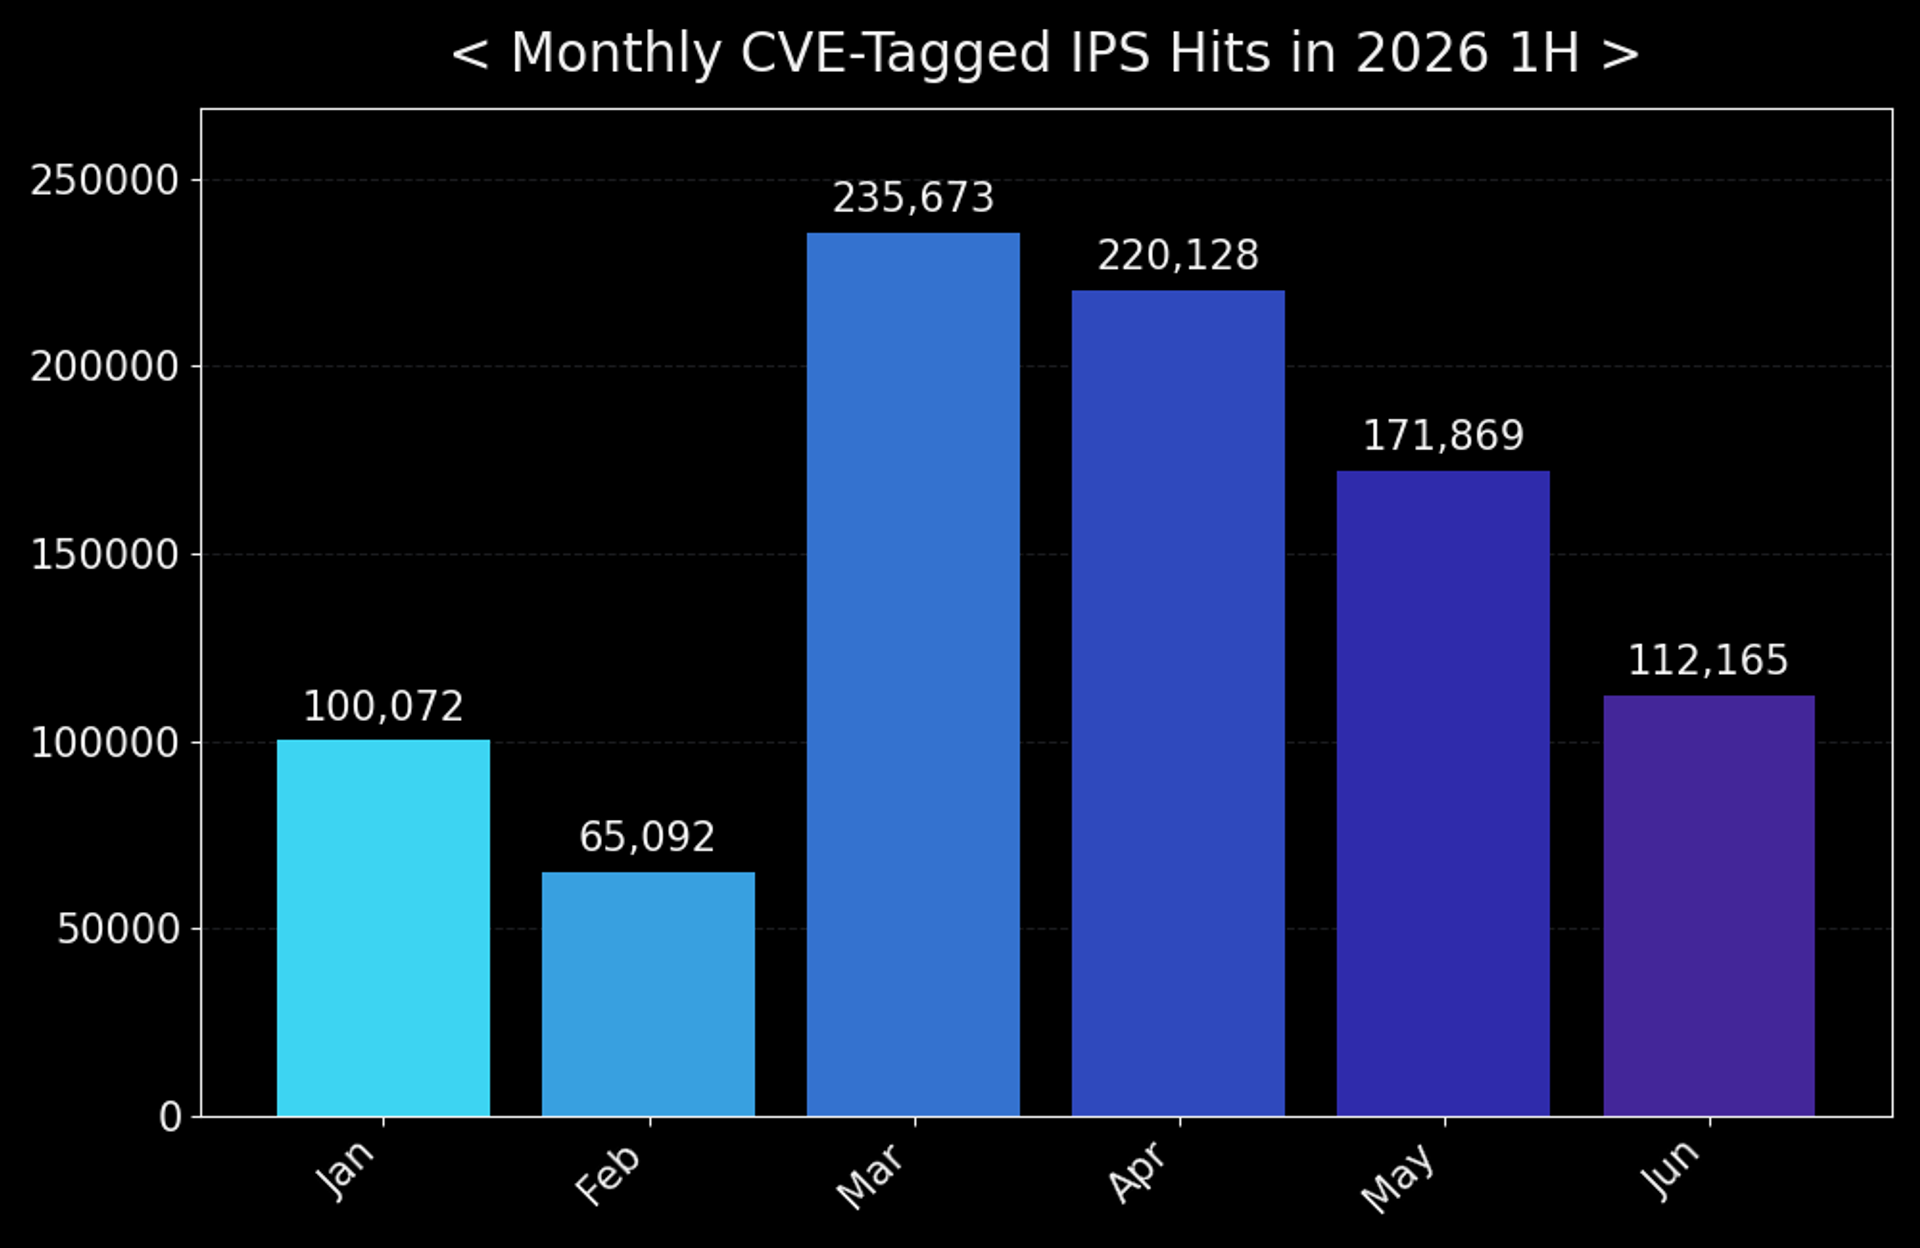
This IPS telemetry adds a network-layer view of exploitation attempts: 904,999 hits tied to a CVE identifier across 589 distinct vulnerabilities. From 100,072 in January, volume dipped to 65,092 in February before jumping to a two-month plateau of 235,673 (March) and 220,128 (April), then easing to 171,869 in May and 112,165 by June.
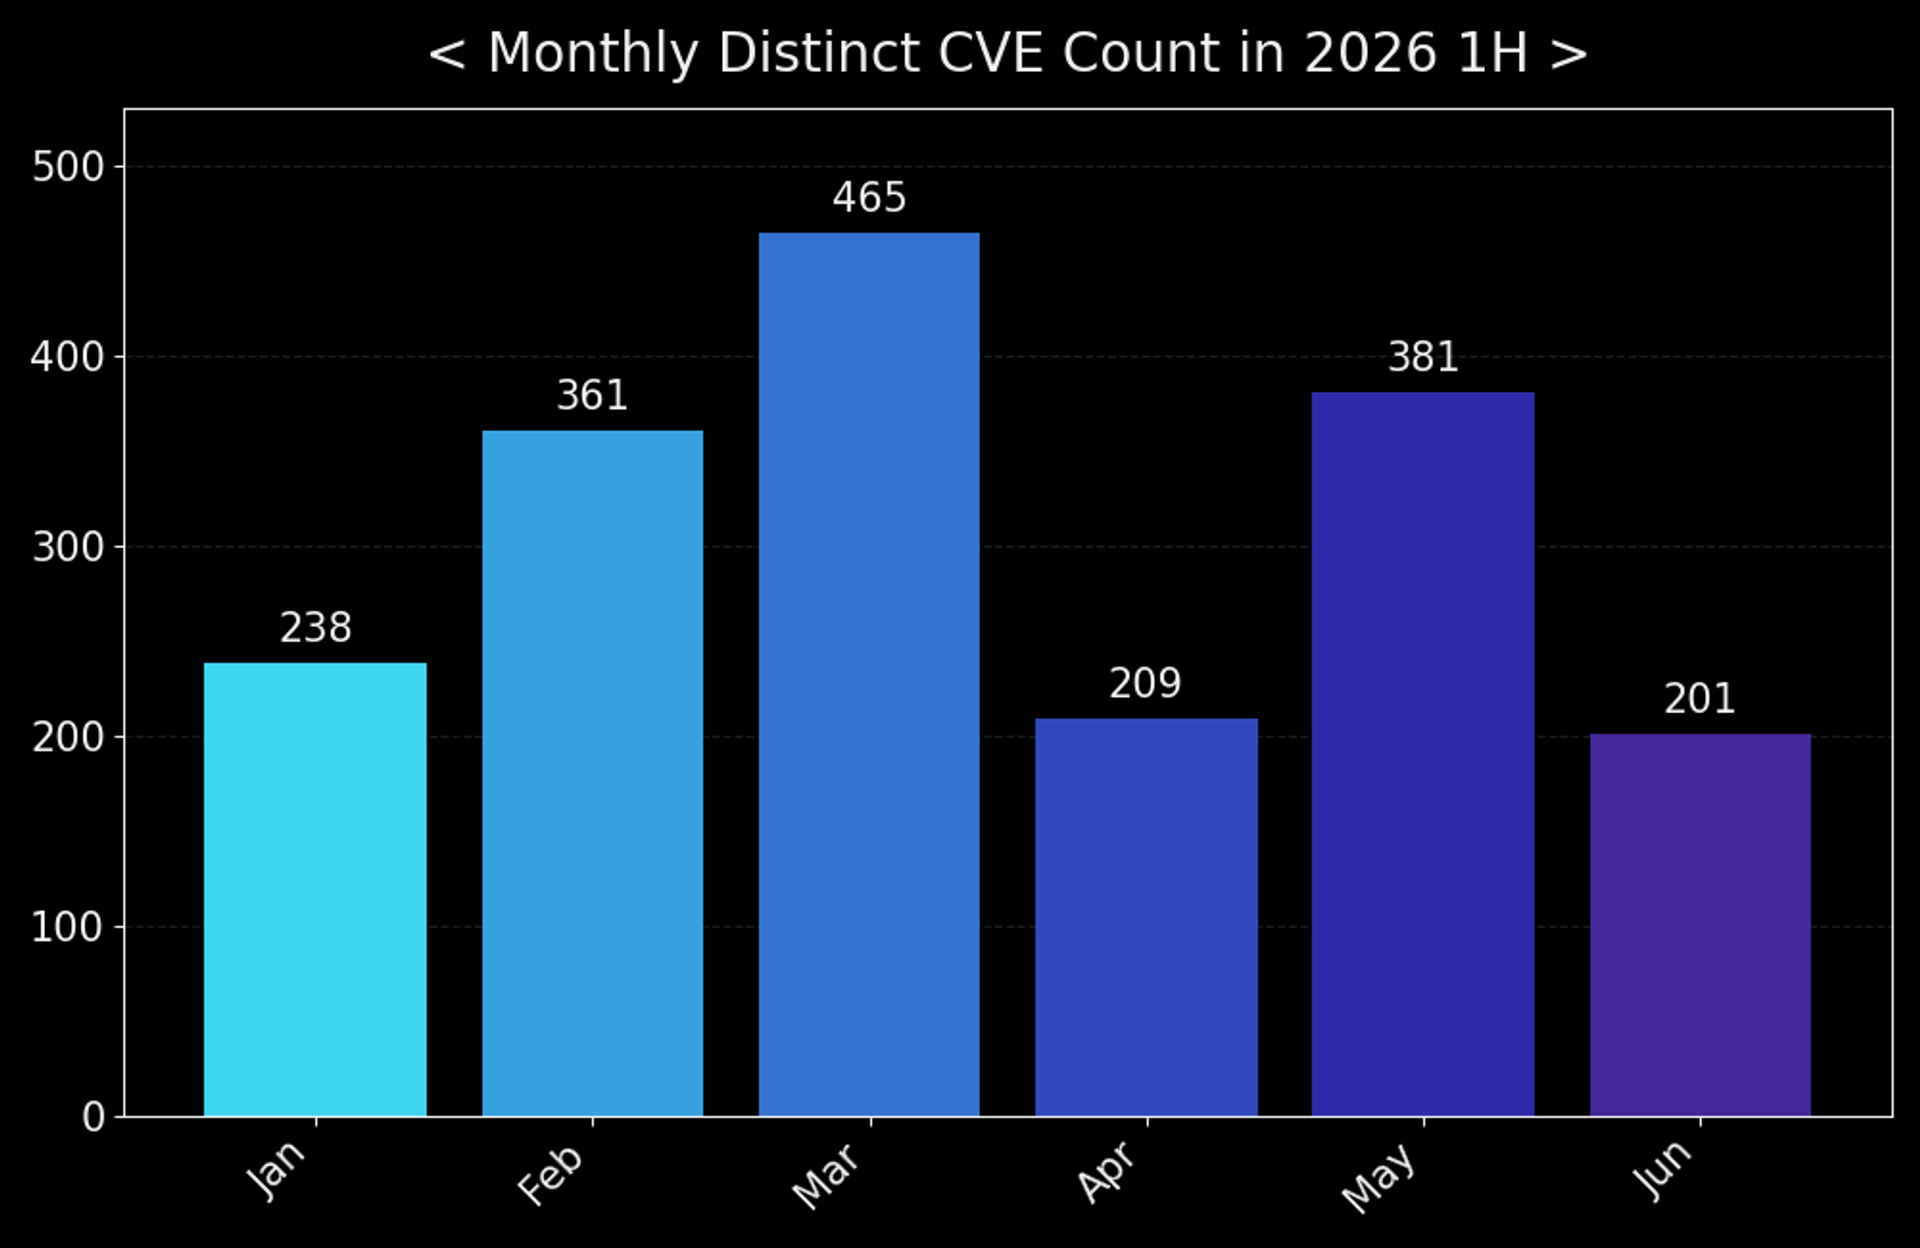
Breadth of exploitation tells a related but not identical story to raw hit volume. The number of distinct CVEs triggered each month also peaked in March (465), consistent with the same broad scanning wave. But April, despite logging the second-highest hit count of the half (220,128), drew on a noticeably narrower set of just 209 distinct CVEs, roughly half of March's variety. That gap suggests April's volume leaned more heavily on repeated hits against a smaller number of already-established exploits, rather than probing a wide range of vulnerabilities the way March did. Distinct-CVE breadth then rebounded in May to 381, the second-highest of the half, even as raw hit volume eased from April's plateau, suggesting May's activity broadened out again after April's narrower, more repetitive pattern.
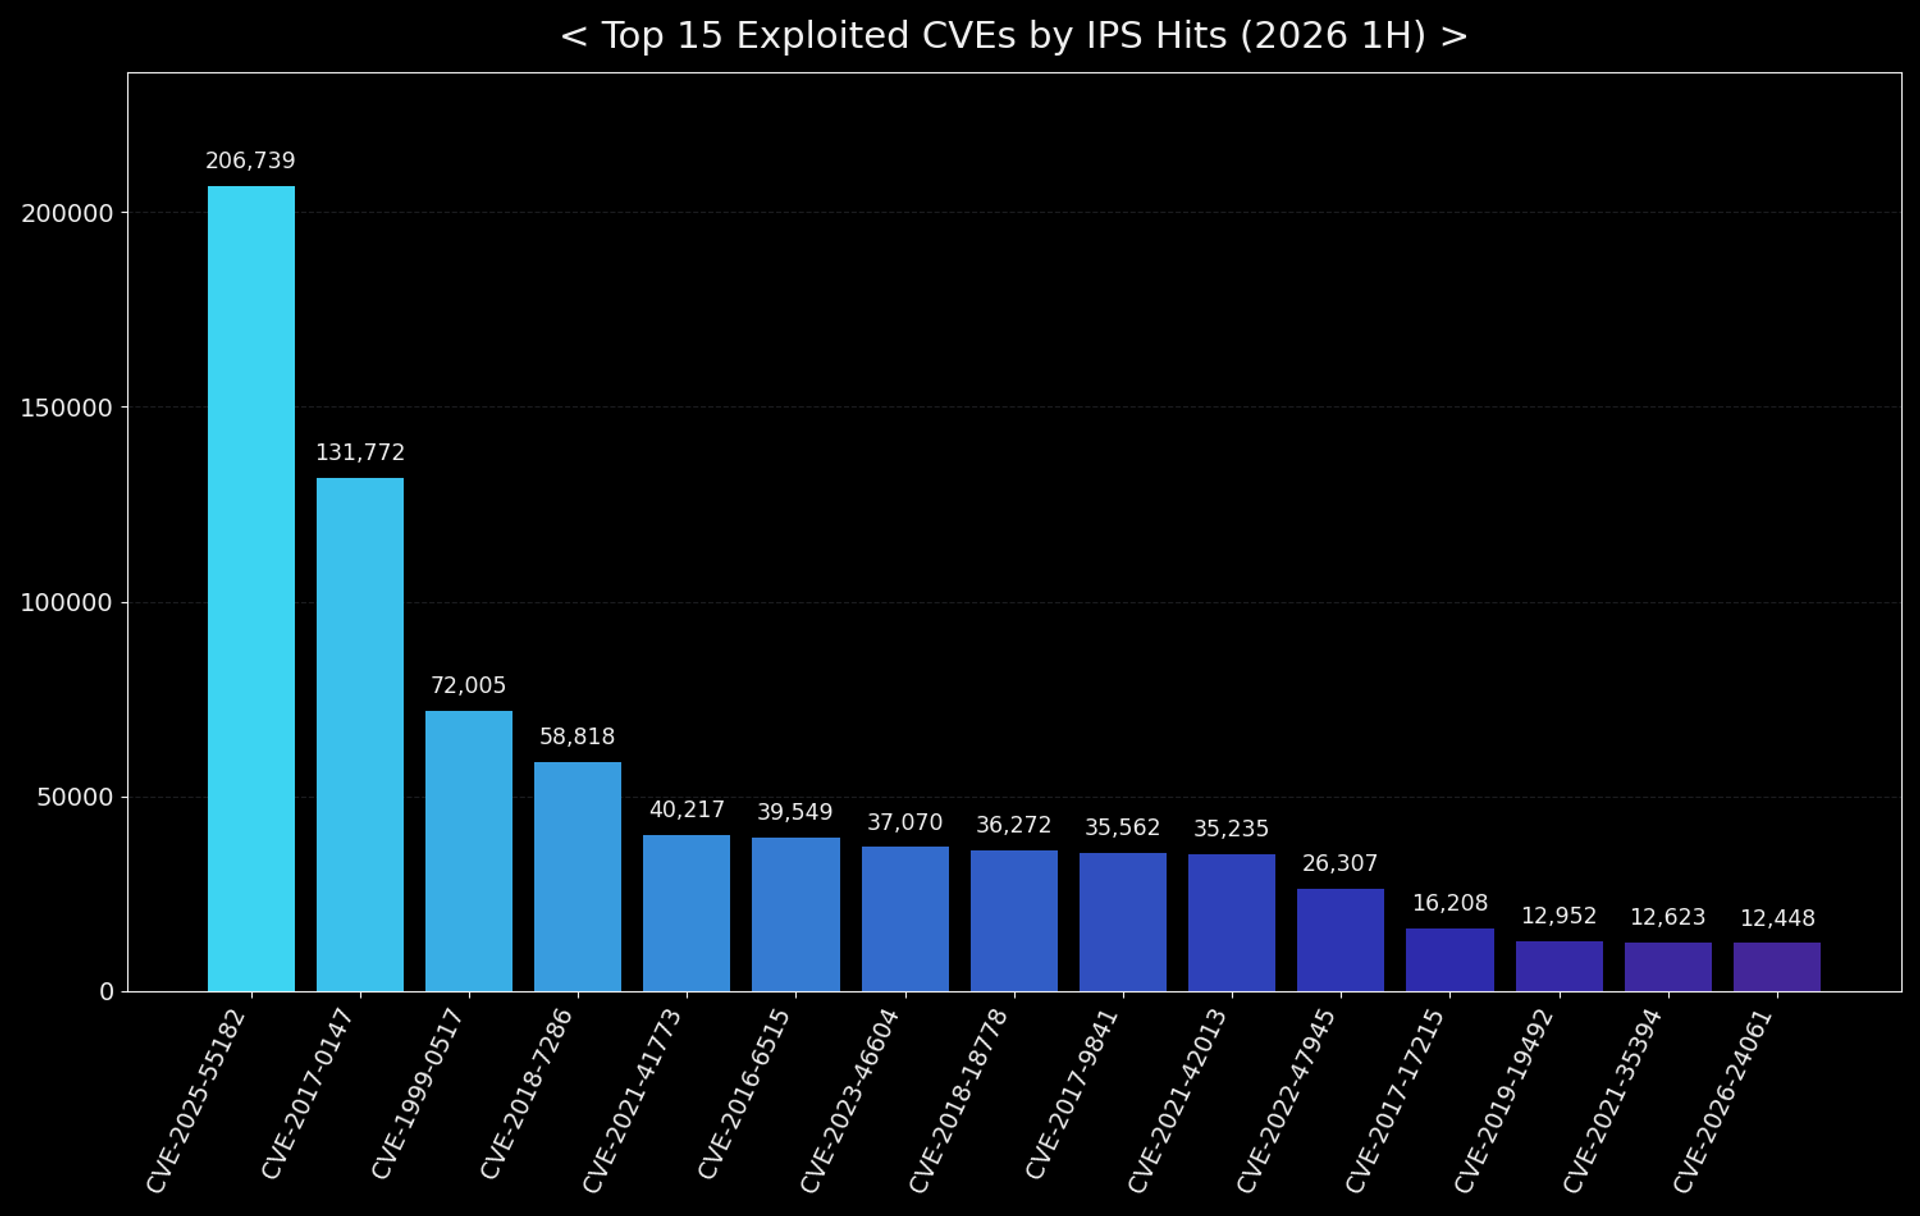
The single most-triggered CVE, CVE-2025-55182, an unauthenticated RCE in React Server Components, generated 206,739 hits, showing how fast a freshly disclosed web vulnerability gets weaponized at scale. Right behind it, CVE-2017-0147 logged 131,772 hits. This is the same SMB-related CVE flagged earlier in this report as one of the most persistent patterns in malware and IPS telemetry, now confirmed independently at the network layer nine years after disclosure.
The most striking entry is #3: CVE-1999-0517, a 27-year-old finding for SNMP running with the default "public" community string, still triggered 72,005 times. Across all 589 CVEs observed, only 88 (15%) were newly disclosed in 2025–2026. The remaining 85% are known, patchable (or simply misconfigured) issues that attackers keep finding exposed. The persistence of MS17-010-era SMB flaws from 2017 (the same bulletin that patched EternalBlue's CVE-2017-0144) and default-SNMP misconfigurations dating back to the 1990s suggests that, within the traffic observed here, unresolved exposure management continues to outweigh the risk from genuinely new vulnerabilities. That same appetite for well-worn, low-effort targets shows up again when the traffic is aimed specifically at the industrial protocols TXOne's honeypots emulate.
ICS/OT Protocol Scanning
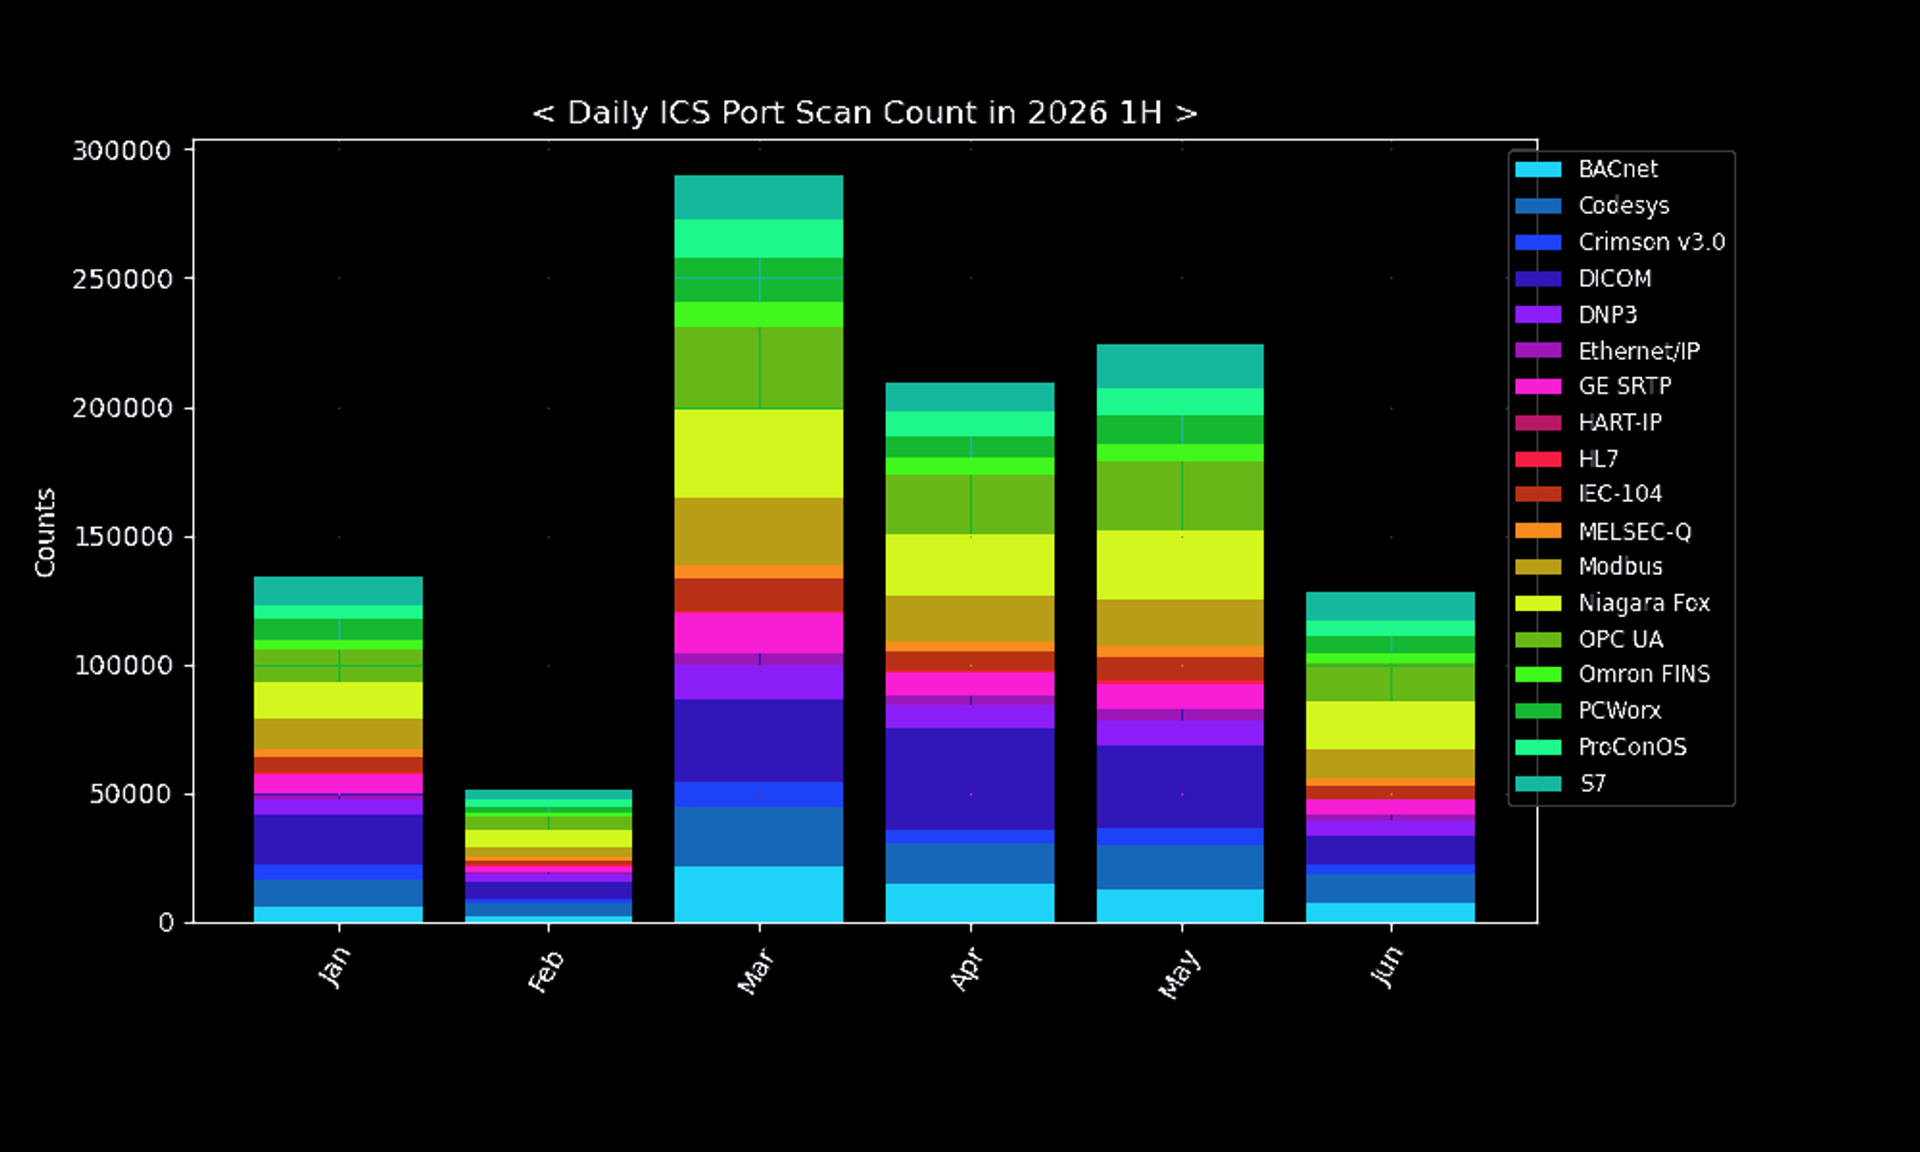
Scanning against emulated ICS/OT protocols (Modbus, S7, DICOM, Niagara Fox, BACnet, and others) followed the same March spike seen in the IPS data above. From roughly 134,000 scans in January and a February low of 52,000, activity jumped to about 289,000 in March before settling into an elevated 200,000–225,000 range through April and May, finally decreasing to 128,000 in June. IPS hits and ICS scanning spiked in the same month, suggesting a single broader scanning wave in March rather than two unrelated events.
Breaking this down by the sector each honeypot profile emulates clearly shows different targeting preferences:
- Automotive — dominated by Crimson v3.0, PCWorx, ProConOS, S7, and MELSEC-Q: PLC and industrial-controller protocols associated with manufacturing floors.
- Energy — concentrated almost entirely in DNP3, Modbus, and S7, the standard SCADA protocol trio, consistent with reconnaissance aimed at grid and industrial-process visibility rather than any consumer-facing service.
- Healthcare & Pharma — led by DICOM (medical imaging) and Niagara Fox (building/facility automation), alongside BACnet, Codesys, and Modbus, a mix that suggests reconnaissance extending beyond clinical systems into the facility-operations layer that keeps a hospital running.
- Oil & Gas — Modbus, S7, GE SRTP, and DNP3, closely mirroring the Energy profile.
Key Takeaways
- March 2026 was the most significant period of the half-year. Payload diversity, CVE-tagged exploitation, and ICS/OT scanning all converged on the same anomaly, consistent with a broad surge in reconnaissance and exploitation activity. This is worth a closer, day-level look in future analysis to identify what specifically drove it.
- Opportunistic attacks continue to dominate. Most observed activity targeted well-known vulnerabilities, default credentials, and exposed services rather than sophisticated zero-days. Patch and configuration hygiene against known issues still delivers meaningful defensive value.
- Cloud infrastructure was the attacker's primary staging ground. With 97% of sessions from the top 99 attacker IPs tracing to hosting providers (AWS alone accounting for a fifth), ASN/reputation-based blocking of bulk-hosting ranges is a realistic control here in a way it wouldn't be against a genuinely distributed botnet.
- Exposure management remains more important than threat novelty. New vulnerabilities like CVE-2025-55182 were weaponized within months, while decades-old issues like CVE-1999-0517 and the MS17-010-era CVE-2017-0147 (patched in the same 2017 bulletin as EternalBlue) are still profitable for attackers. Both fast patch cycles for new disclosures and periodic hygiene sweeps for old defaults belong in the same program.
- Credential attempts show application-aware targeting, not just generic stuffing. Beyond the usual IoT default-login list, a cluster of credential attempts tailored to Solana blockchain infrastructure has appeared. Any internet-facing service, blockchain infrastructure included, needs default credentials disabled and key-based auth enforced.
- Industrial reconnaissance is sector-aware, not generic. Protocol preferences differ meaningfully across healthcare, energy, automotive, and oil & gas: DICOM/building-automation for healthcare, Modbus/S7/DNP3 for energy and oil & gas, and PLC-facing protocols for automotive. Security teams should target monitoring resources at what each sector's environment actually exposes.
References
SANS Internet Storm Center, "The Top 10 Not So Common SSH Usernames and Passwords", October 2024. https://isc.sans.edu/diary/31360
Microsoft, "Microsoft Security Bulletin MS17-010 - Critical", March 2017.
React team, "Critical security vulnerability in React Server Components" (CVE-2025-55182), December 2025.
This report was prepared with the assistance of AI tools.
Tags
About the Author
TXOne Threat Research
Threat Research Team
TXOne's Threat Research team monitors the evolving OT threat landscape, analyzing emerging threats and vulnerabilities affecting industrial control systems and critical infrastructure.